


- Key Takeaways
- What Do the Latest OnlyFans Statistics Show About U.S. Fan Spending in 2025?
- Why Does California Lead Total OnlyFans Spending But Rank 10th Per Capita?
- Which States Have the Lowest OnlyFans Fan Spending — and What Does That Tell Creators?
- What Do OnlyFans Statistics Mean for Creators Targeting U.S. Audiences?
- ViceSnob's Take
The U.S. fans spent $2.63 billion on OnlyFans in 2025 — and a first-of-its-kind geographic breakdown published by OnlyGuider on June 2, 2026 reveals exactly which states drove that number, and which ones are being almost entirely ignored by creators. If you’re curious about OnlyFans statistics, California contributed $350.6 million to that total, more than any other state. But by the metric that actually matters for creator strategy — spending per capita — California doesn’t even crack the top nine.
We analyzed the full 50-state dataset from OnlyGuider’s U.S. Spending by State & City 2025 report, cross-referenced with their companion 2026 Creator Census (covering 1,297,804 verified U.S. creators), and the picture that emerges is one most creators have never seen. The highest-spending audiences aren’t where the content is concentrated. Some of the country’s lowest-spend states have individual cities outperforming the national average. And the entire Deep South — five states, roughly 40 million people — is functionally underserved.
Key Takeaways
- U.S. OnlyFans fan spending totaled $2.63 billion in 2025, averaging $77,334 per 10,000 residents nationally (OnlyGuider U.S. Spending Report, June 2026)
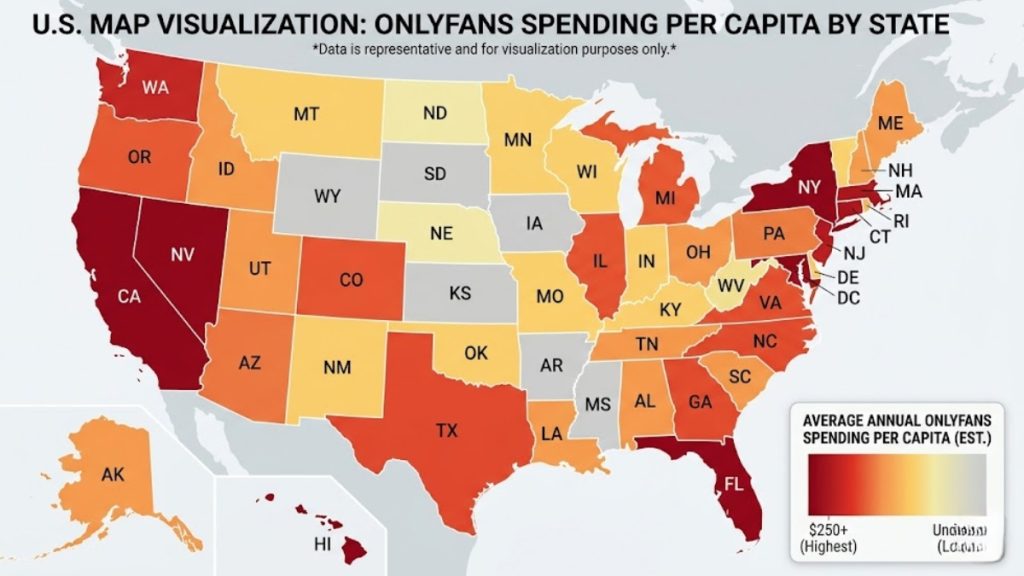
- California led all states in total spend at $350.6M (12.98% of the U.S. market) but ranked just 10th per capita at $88,916 per 10,000 residents
- Washington, D.C. had the highest per-capita spend in the country at $129,655 per 10,000 residents — 68% above the national average
- Mississippi ranked last at $46,682 per 10,000 residents, with Tennessee, Arkansas, Louisiana, and Alabama also in the bottom five — all 39% or more below the national average
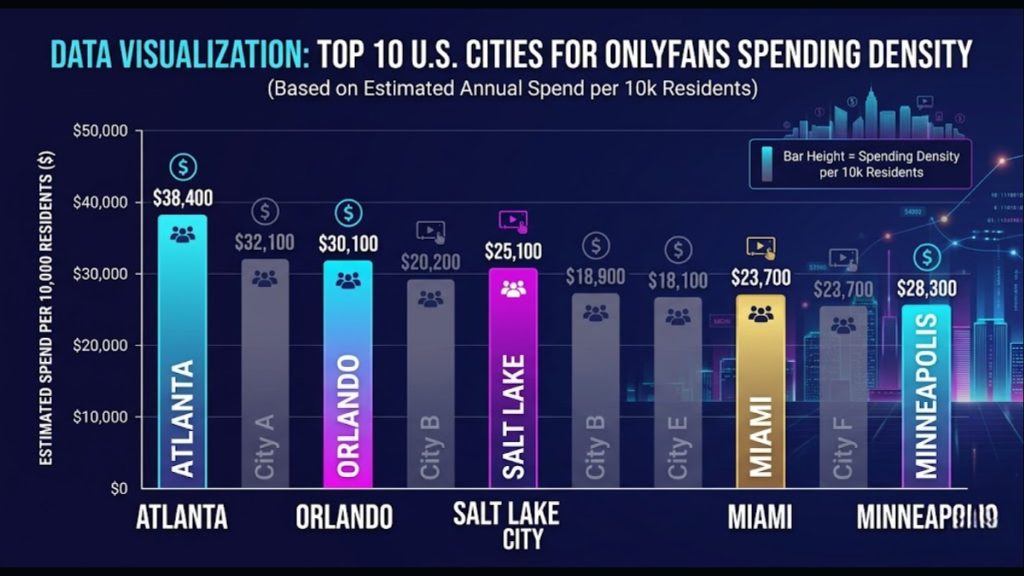
- Atlanta, Georgia ranked #1 among all U.S. cities for spending density at $525,475 per 10,000 residents — roughly 3× what Los Angeles generates per capital.
What Do the Latest OnlyFans Statistics Show About U.S. Fan Spending in 2025?
The U.S. generated more OnlyFans revenue than any other country in 2025 — $2.63 billion out of $7.2 billion globally, according to OnlyGuider’s analysis published June 2, 2026. That’s 36.5% of global consumer spend from a single country.
The methodology: OnlyGuider built a proprietary financial model using Google Ads API search volume data, validated against OnlyFans’ audited annual filings. The model calculates regional spend using a Revenue Per Search algorithm, standardized to spending per 10,000 residents for cross-state comparison.
California ($350.6M), Texas ($248.4M), New York ($167.1M), and Florida ($159.6M) hold the top four spots by total spend. Together, those four states account for nearly $926 million — about 35% of the entire U.S. market. For creators chasing raw audience size, that’s where the money is in absolute terms.
The U.S. held 36.5% of global OnlyFans consumer spend in 2025, making it by far the platform’s largest national market.
Why Does California Lead Total OnlyFans Spending But Rank 10th Per Capita?
California’s $350.6 million figure is almost entirely a population effect. The state has 39.5 million residents — so even at $88,916 per 10,000 people, the absolute total is enormous.
But nine states and D.C. show higher per-capita engagement. Washington, D.C. leads at $129,655 per 10,000 residents. North Dakota is second at $108,067 — a state most creators have never considered targeting. Nevada ($99,423), Colorado ($95,116), and Illinois ($93,176) round out the top five.
What explains the Mountain West and Mid-Atlantic dominance? We don’t have a single answer, but the correlation with high-income urban populations and low-tax states (Nevada, Wyoming, North Dakota) is consistent with discretionary spending patterns across other premium digital subscription categories. These states don’t have more people. They have more spending people.
For creators, this is the buried insight. A creator with 10,000 subscribers in North Dakota is likely pulling in more revenue per subscriber than a creator with the same count in Florida — where the state ranks 41st in per-capita spend at $68,320 per 10,000 residents. Florida has the third-largest creator population in the country (120,772 creators per the 2026 Creator Census), but a per-capita spend figure well below average. Supply is high. Demand, relatively speaking, is not.
Per-capita spending data shows that creator audiences in D.C., North Dakota, Nevada, and Colorado spend significantly more than the national average — making them high-value targeting opportunities regardless of raw audience size.
Which States Have the Lowest OnlyFans Fan Spending — and What Does That Tell Creators?
The five lowest per-capita states are:
Mississippi’s $46,682 per 10,000 is 39.6% below the national average. OnlyGuider attributes the pattern to the Deep South and Bible Belt showing “the lowest engagement per capita” nationally.
But look at the city-level data from that same report, and something shifts. Jackson, Mississippi — the state’s capital — spent $93,186 per 10,000 residents. That’s above California’s state average. New Orleans, Louisiana posted $136,850 per 10,000 residents, 77% above the national average. Individual cities within low-spend states are outperforming.
The state-level underperformance is a rural drag, not a uniform attitude. Creators writing off the entire South based on state averages are likely missing the urban pockets that spend at the same clip as the coasts.
Louisiana’s $26.4M total — while ranking near the bottom per capita — still represents over $26 million in annual fan spending flowing out of one state. There are creators building entire businesses on less.
Mississippi, Tennessee, Arkansas, Louisiana, and Alabama rank as the five lowest states for OnlyFans per-capita fan spending in 2025 — but city-level data shows individual urban markets within those states significantly outperform their state averages.
What Do OnlyFans Statistics Mean for Creators Targeting U.S. Audiences?
The data frames a practical question: are creators marketing based on where they think their audience is, or where the audience actually spends?
Atlanta is the most striking example. The city posted $525,475 in spending per 10,000 residents in 2025 — first among all 167 U.S. cities in the OnlyGuider dataset, beating Los Angeles ($178,447) by 3× and New York City ($99,086) by more than 5×. Orlando ($466,430) and Salt Lake City ($412,038) are second and third. None of those are cities typically associated with OnlyFans creator marketing strategy.
We also see a structural creator-audience mismatch when you overlay the Creator Census data. Nevada has the highest creator density in the country at 1,648 creators per 100,000 residents — nearly 4× the national average. But Nevada’s per-capita fan spend ($99,423) trails Washington, D.C.’s ($129,655) and North Dakota’s ($108,067) by a meaningful margin. The platform’s creator supply has clustered in different places than its consumer demand.
For a creator making decisions about where to run paid promotions, which audiences to target on social, and how to frame geographic personas in content — these numbers matter. The OnlyFans Complete Guide covers platform mechanics in depth, but this data adds a layer of geographic strategy the guide can’t.
ViceSnob’s Take
Here’s what the numbers actually say: the OnlyFans creator economy in the U.S. is a $2.63 billion market built on a geographic mismatch that nobody’s talking about. Content is concentrated in coastal cities. Money is concentrated in Mountain West states, Mid-Atlantic corridors, and — at the city level — in Sun Belt metros that most creators treat as afterthoughts.
The Atlanta figure alone should reset how creators think about audience geography. A city of under 500,000 people is spending at more than 5× the per-capita rate of New York City. That’s not random. That combination of high discretionary income, relatively younger demographics, and high digital engagement is exactly the profile that converts to OnlyFans spending — and creators who figure that out first have a structural advantage.
The counterintuitive read: if you’re marketing to New York and Los Angeles because “that’s where the money is,” you may be targeting the most crowded, lowest-converting geographies relative to spend density. The underserved audience is in Denver, Chicago, Phoenix, and Atlanta — and apparently in the rural pockets of deep-red states that state-level averages have been obscuring.
Browse creators by category, location, and niche in the ViceSnob Creator Database — the most complete searchable index of OnlyFans creators in the U.S.
The full OnlyGuider dataset covers 3,092 U.S. counties. The geographic opportunity for targeted creator marketing hasn’t been this well-documented before. Creators who ignore the data are leaving subscriber acquisition efficiency on the table.
FAQ
A: California leads all U.S. states with $350.6 million in total OnlyFans fan spending in 2025 — representing 12.98% of the entire U.S. market, according to OnlyGuider’s June 2026 spending report.
A: Washington, D.C. leads with $129,655 per 10,000 residents, followed by North Dakota ($108,067) and Nevada ($99,423), according to OnlyGuider’s U.S. Spending by State & City 2025 report published June 2, 2026.
A: Mississippi ranked last among all 50 states and D.C. at $46,682 per 10,000 residents in 2025 — 39.6% below the national average of $77,334. Tennessee, Arkansas, Louisiana, and Alabama also ranked in the bottom five (OnlyGuider, June 2026).
A: U.S. consumers spent $2.63 billion on OnlyFans in 2025, making the U.S. the platform’s largest single national market at 36.5% of global gross payment volume of $7.2 billion (OnlyGuider Wrapped 2025 / U.S. Spending Report, June 2026).
A: Atlanta, Georgia ranked #1 among all 167 U.S. cities analyzed by OnlyGuider, with $525,475 in spending per 10,000 residents in 2025 — more than 3× Los Angeles and 5× New York City on a per-capita basis.


Leave a comment